BigQuery is a fully managed Data Warehouse - meaning you don’t have to worry about the underlying architechture. Now given this, it is very important for an end user to be able to consume, process and analyze metadata & metrics related to jobs/queries/tables/storage etc, stay on top wrt the health of the Data Warehouse in general. In this blog post, we will dive into the power of BigQuery’s Information Schema Metadata and explore how it can help you better understand and manage your data in BQ.
Why is Metadata even worth talking about?
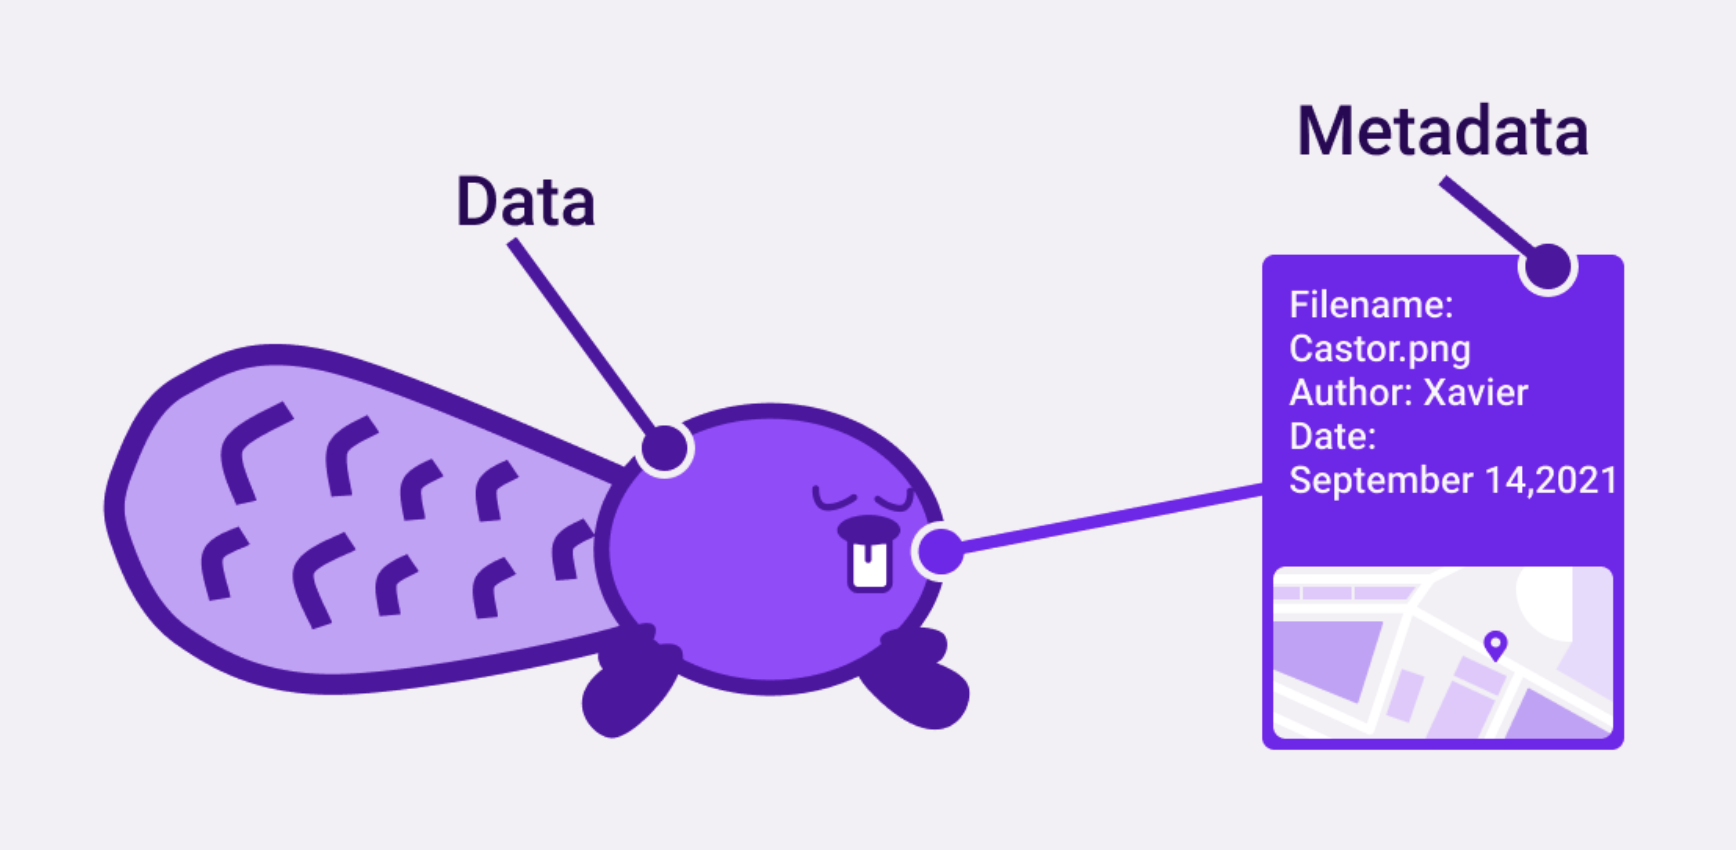
Many define metadata as “data about data”. So, it is data that provides information about your data. For example - size, creation time, modification time, permission etc. It tells you what data you have, where it comes from, what it means and what its relationship is to other data that you have. Cultivating metadata about your data objects will impact your organization in ways you can’t imagine - it essentially helps you manage and monitor your assets better.
[Image Reference - This is a great article on meaning of metadata and it’s significance for maintaining org level data quality]
If your organization collects & stores data, you definitely need a metadata view. You can have great tables and datasets but if you don’t know their what’s & where’s - you’re not extracting their true value.
What is BigQuery’s INFORMATION_SCHEMA?
BigQuery offers a set of native metadata tables called BigQuery INFORMATIONSCHEMA (documentation here), which provide comprehensive data on consumption and performance. If you’re using BigQuery and not leveraging BigQuery’s these metadata Tables, you’re missing out on so much, literally. There are tons of Data Observability platforms that help you flag issues in data, just by leveraging metadata through INFORMATIONSCHEMA. If they can make money by leveraging your org’s metadata, you can definitely extract so much value yourself!
Say your org uses BQ as the Data Warehouse, INFORMATION_SCHEMA will help you answer the following questions:
- How many slots do we use on a daily basis?
- What is the busiest/peak time for our jobs - when do most of queries run?
- Which are our costliest queries? Who is/are writing them?
- How many queries does an average person in our org run/day?
- How many tables & datasets are present in BQ? What are their sizes?
- What are some tables that haven’t been used by anyone in the past X days but eating up storage space?
Some ways to use INFORMATION_SCHEMA effectively
-
Manage Capacity & Reservations
- You can query the jobs metadata tables & reservation metadata tables to understand which jobs are using how many slots & how much of your total reserved slots are you using currently.
- Investigate windows and patterns of high and low consumption against capacity to optimize slot demand & capacity distribution
-
Monitor Slot Consumption & compute health 🩺 of your BQ env 😷
- Monitor overall health and performance of the BigQuery environment, by identifying troublesome queries and users driving performance issues
- Break down queries into granular job stages and aggregate these across queries to identify query patterns and opportunities for table optimization
-
Monitor Table Storage growth & usage:
- Tables metadata will help you monitor which table is being used the most, which table is the most cost/storage heavy, which table is redundant/unused etc.
- By providing insight into the structure and usage of your datasets, it can help you better understand your tables and make more informed decisions - whether it is Table deletion, Table retention or Table Archival.
-
Monitor Freshness & Volume of your Streaming Tables ♨
- streaming data view contains per minute aggregated streaming insert statistics for the table at project & organization level
- You can easily run
COUNT(*)&SUM()queries to monitor freshness, staleness & volume of your tables, almost real time!
-
Manage people & costs
- jobs metadata will show you who is running the costliest queries. Use name/shame to get them to optimize their queries 🤭
- You can convert totalslotms to a cost view basis your slot reservation pricing.
- Identify opportunities to optimize performance and slot consumption & save costs! (like we did 🤓)
-
Create Dashboards 📊 on top of INFORMATION_SCHEMA views to build your inhouse data observability platform!
- Maintaining & storage of these metadata tables is free (BQ manages them), you only have to pay for querying these tables.
- So you can create exhaustive dashboards for wider visibility + alerts!
So, be smart & make the most of your investment in BigQuery by leveraging INFORMATION_SCHEMA tables! 🌟